Problem
Know what is broken before an auditor does
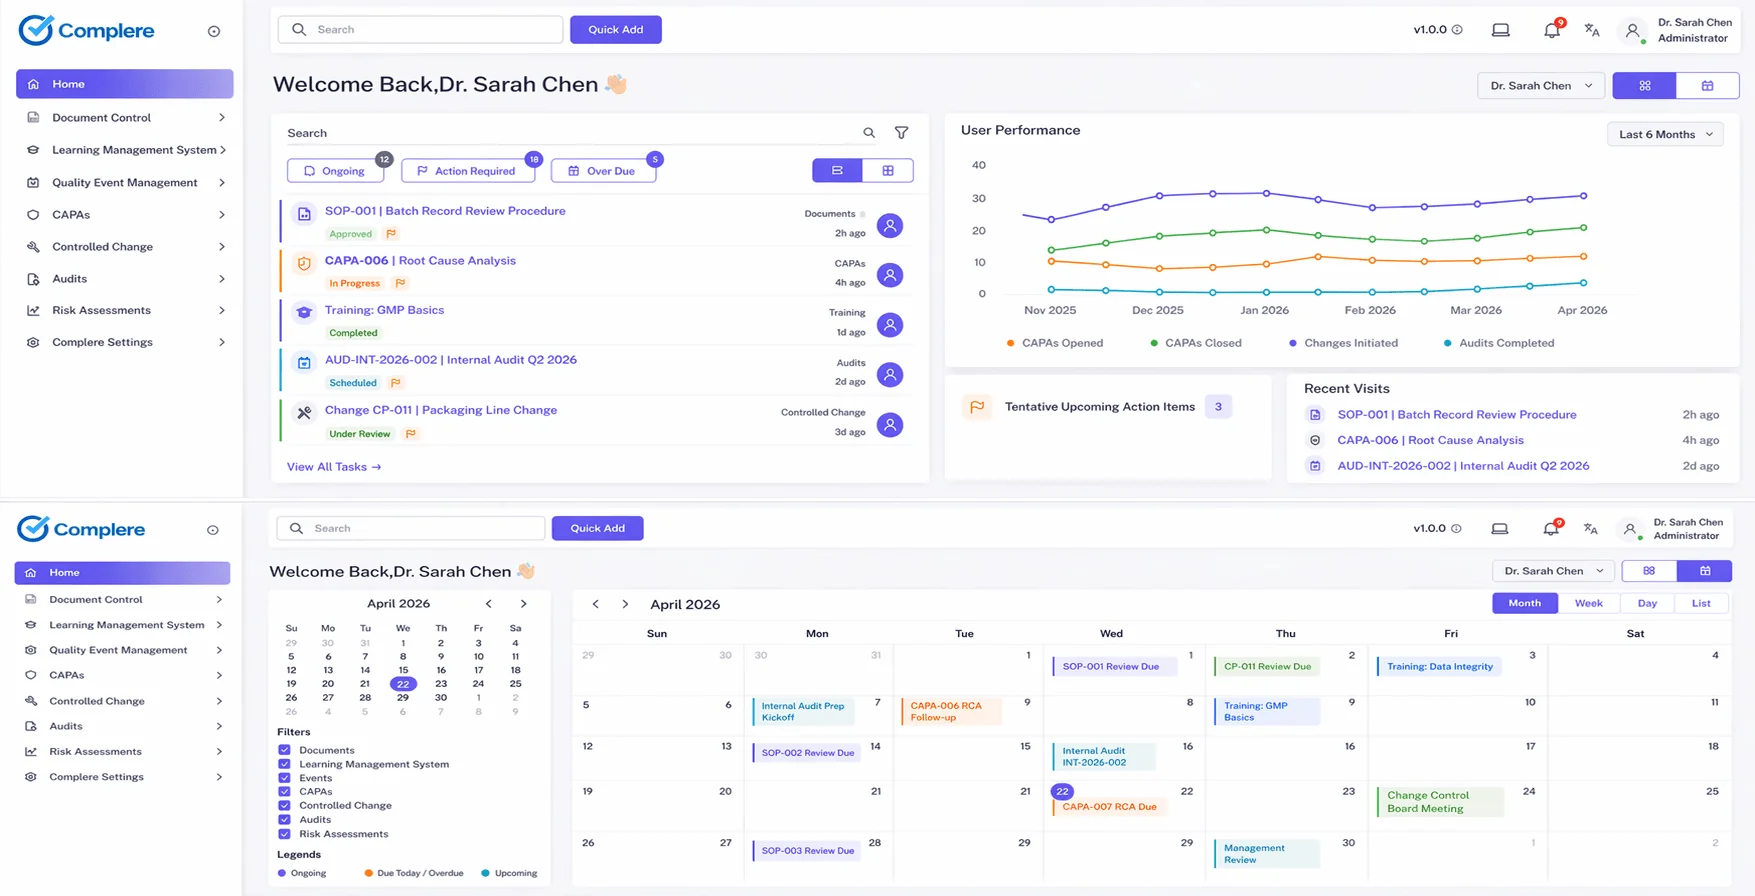
Leadership sees overdue CAPAs, aging deviations, training gaps, and audit follow-ups in one place — instead of reconciling exports from five systems the week before an inspection.
Dashboards and KPI pages show how Complere turns open events, CAPA aging, training risk, audit status, and site-level trends into a usable management view — with drill-down to signed records so leadership and compliance reviews share one factual baseline.
How this module improves quality operations, reduces compliance risk, and supports inspection readiness for regulated teams.
Leadership sees overdue CAPAs, aging deviations, training gaps, and audit follow-ups in one place — instead of reconciling exports from five systems the week before an inspection.
Dashboard tiles link to the underlying quality records with full history, so metrics are explainable under scrutiny, not vanity charts.
Trend and backlog views feed management review, CAPA effectiveness, and continuous improvement — the same narratives regulators and customers ask for.

Each step in this workflow is supported by governed records, electronic signatures, and a full audit trail — so quality operations stay traceable and inspection-ready.
Collect open items, completion signals, and trend lines across modules.
Prioritize overdue or high-risk items for leadership review.
Move from KPI to record-level evidence without losing context.
Use recurring metrics to show whether actions are working.
The specific controls, features, and workflow functions built into this module to support your quality and compliance objectives.
Highlight the indicators leadership uses most often.
Keep aging and priority signals visible before they become inspection pain.
Move from a dashboard tile into the underlying event, CAPA, audit, or training data.
Turn live status into a repeatable review pack. See the management review capability.
From daily operational tracking to executive review packs, Complere dashboards make quality status visible, actionable, and inspection-ready.